The stock market: setting realistic expectations
Investing for beginners: Part 2 of 8
It is often said that the stock market is a risky and long-term investment, but what does this actually mean?
Risk can mean a number of things, depending on the context. For example, risk can be defined as how volatile it is by measuring the standard deviation of an asset’s returns. Below is an example of different standard deviations:
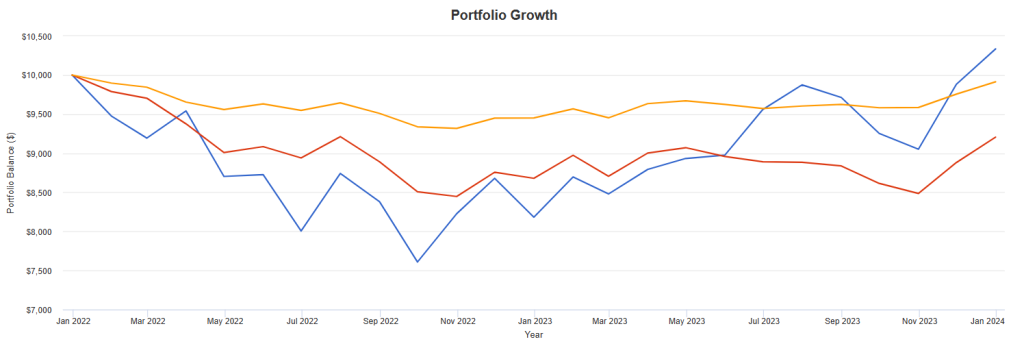
There is a general rule-of-thumb in finance called the risk-return tradeoff, where the more risk you take, the higher the expected return. Cash is an example of an asset that has practically no risk and so the return you get may or may not beat inflation. Some more examples of asset classes are:
- Stocks: represent a share in the ownership of a company.
- Bonds: an investor lends money to a company or the government in exchange for regular interest payments for a certain period of time (e.g., 10 years). After the period ends, the investors receive the original amount they lent. This is also how term deposits work, the difference being that bonds can be bought and sold on the market.
- Bills: a shorter-term version of bonds, with a period of 1 year or less.
To better understand the relationship between returns and risk, I used the annual returns of Australian stocks, bonds, and bills from 1900 to 2020. I then adjusted the returns to take inflation into account, also known as real returns. The dataset I used is organised by Jordà, Knoll, Kuvshinov, Schularick, and Taylor, accessed in December 2023. Note: from 1944 to 1946, Australia had missing bills data, so I had to use linear interpolation to replace the missing values.
The calculations I’ve done can be found here if someone wants to double check: https://docs.google.com/spreadsheets/d/1LBBQszRgAXkYtd2yEO1BkyL2QHPRPNUh0_k6ezt-bjk/edit?usp=sharing
First, let’s look at the standard deviations of stocks, bonds, and bills:
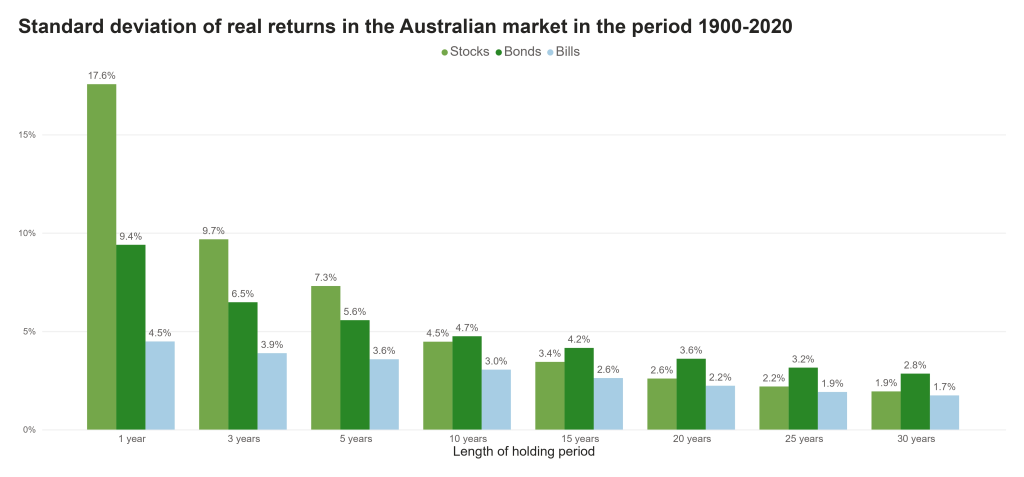
As we would expect, when looking at 1-year returns, stocks have the highest standard deviation, followed by bonds and bills. However, when we are looking at returns over longer time horizons, the standard deviation for stocks dramatically decreases, such that when looking at 30-year returns, stocks now have a similar standard deviation to bills. So when looking at standard deviations, stocks become “less risky” over time.
Another way we can define risk is the chances of not losing money. This is shown in the graph below:
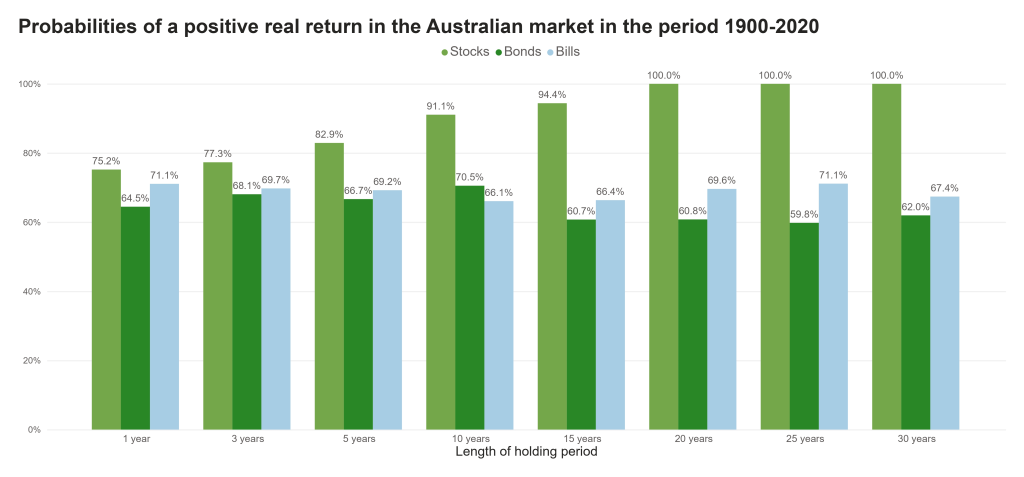
Of the 121 years in the sample, stocks had a positive real return in roughly 75% of those years, followed by 71% for bills and 65% for bonds. It may be surprising to see stocks have the highest percentage, but that’s because the analysis took inflation into account. If I remove inflation, we get results that we would expect for a 1-year holding period:
- Stocks: 79.3%
- Bonds: 82.6%
- Bills: 100.0%
Over long holding periods, stocks become “less risky” as they become more likely to earn a positive real return, whereas bonds and bills stay roughly the same.
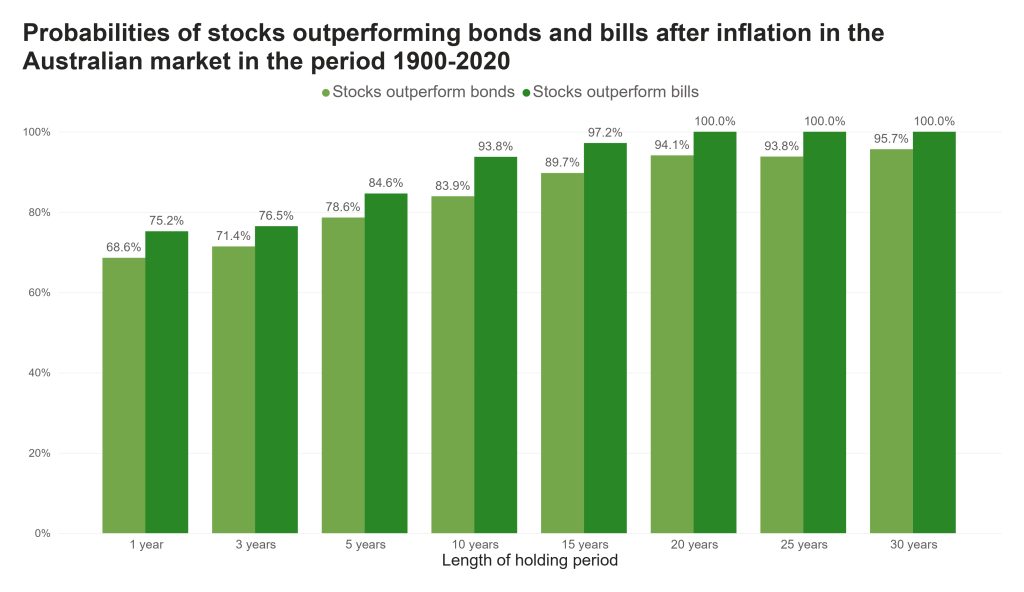
Stocks also become “less risky” as stocks have a higher chance of outperforming bonds and bills over longer holding periods, as seen below:
Of course, stocks suffer significantly higher negative returns in the short term than bonds and bills. We can see this in the below graph:
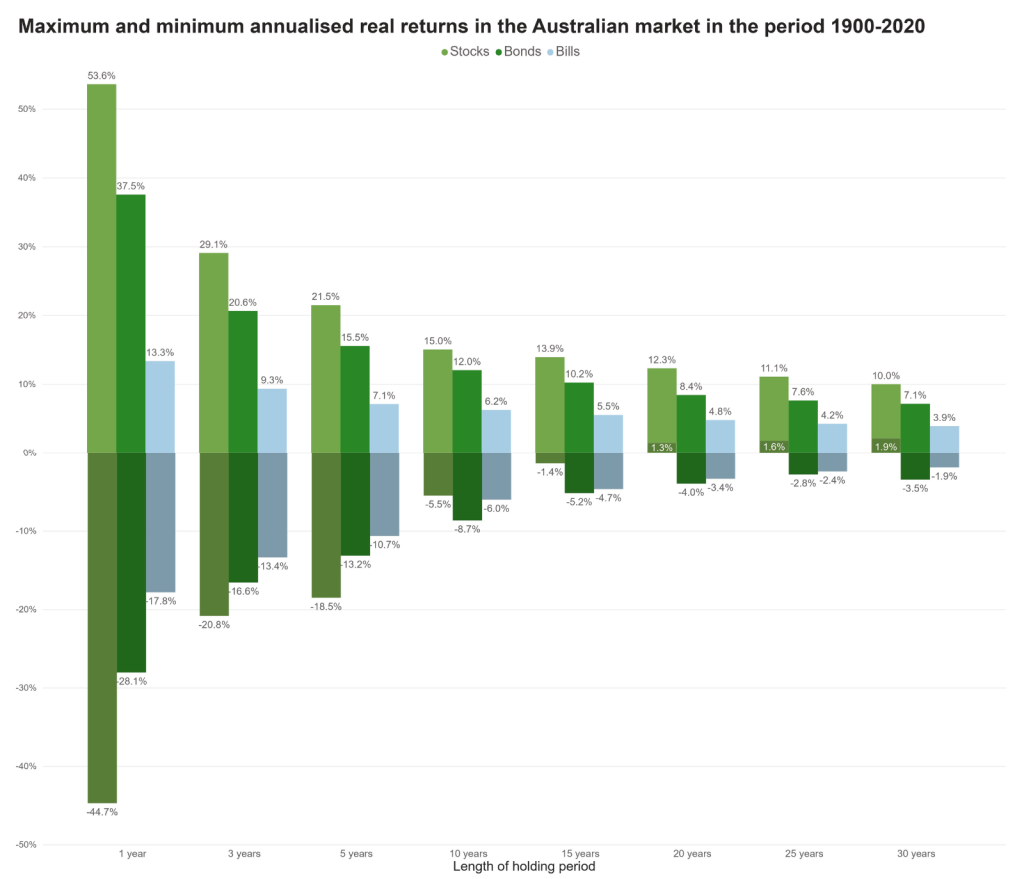
Although stocks had the largest negative real return of -44.7% in a year, over longer holding periods, the minimum annualised real return for stocks eventually became positive. So if one is accumulating over a long period of time and wants to make sure the returns beat inflation, then stocks are the safest option relative to bonds and bills.
However, when looking at risk through the lens of how much money will there be in the best-case scenario vs the worst-case scenario, stocks do become more risky over longer holding periods:
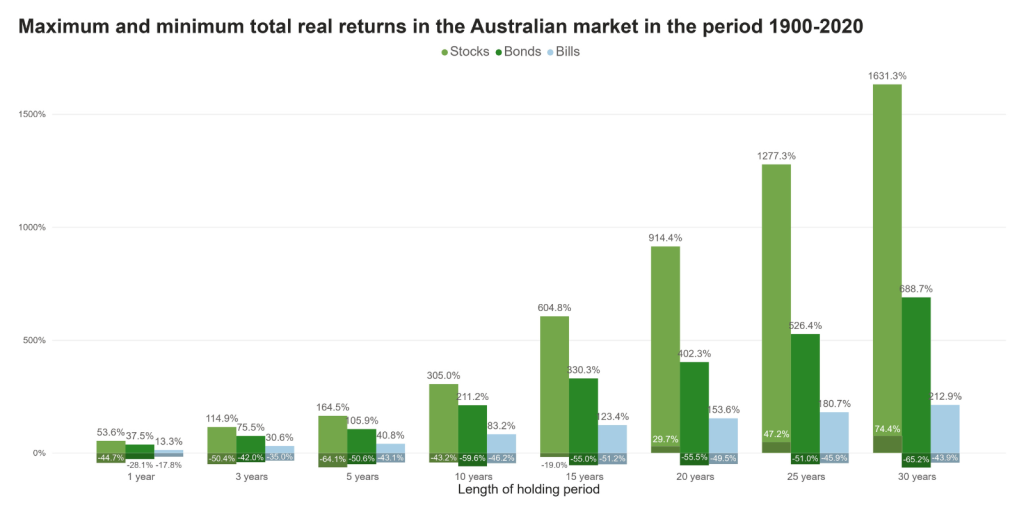
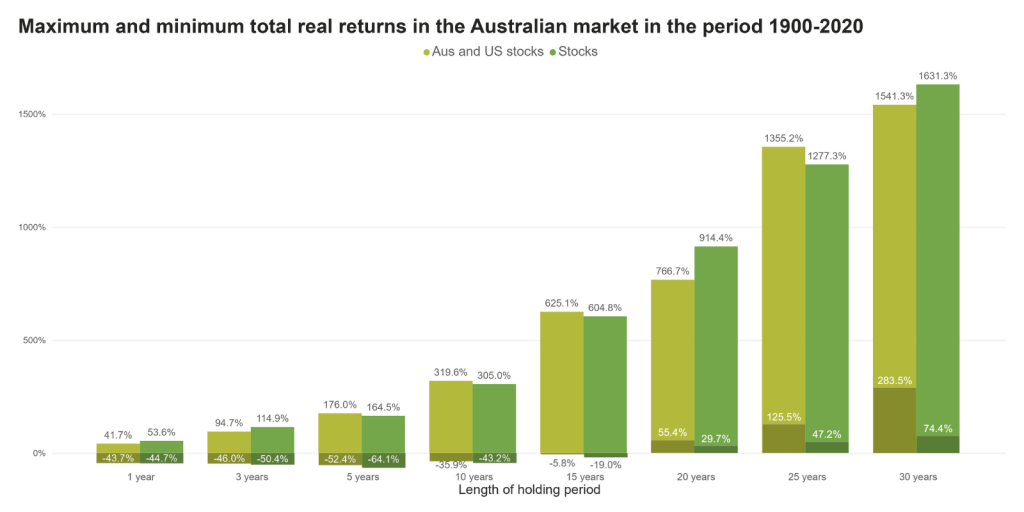
Unlike the previous graph, where I was showing annualised real returns (average performance), this graph shows the total return. We can see that the range in returns for stocks increases over time, with the range being much wider than bonds and bills. To conceptualise how big the range is for stocks over a 30-year holding period, say someone invested a lump-sum of $100,000; based on the historical data analysed, this lump-sum could be as little as $174,400 and as much as $1,731,300 after 30 years.
To summarise risk, over longer holding periods, stocks become “less risky” when looking at the standard deviation, the frequency of a positive real return, the frequency of outperforming bonds and bills, and the range of annualised real returns. However, stocks do become more risky when looking at the range of total returns.
Although stocks are risky, there is a way to marginally reduce their risk, and that is through diversification.
Diversification is when we add another asset to the portfolio such that there is an imperfect correlation between the two assets. What I mean by imperfect correlation is that the two assets don’t move perfectly in tandem. For example, when one asset is doing poorly for one year, the other asset could be doing far better, and vice versa.
To demonstrate the effectiveness of diversification, I’ll be repeating the previous graphs but with a new variable, 50% US stocks and 50% Australian stocks (I chose 50%/50% for simplicity). Below is the graph for the standard deviation:
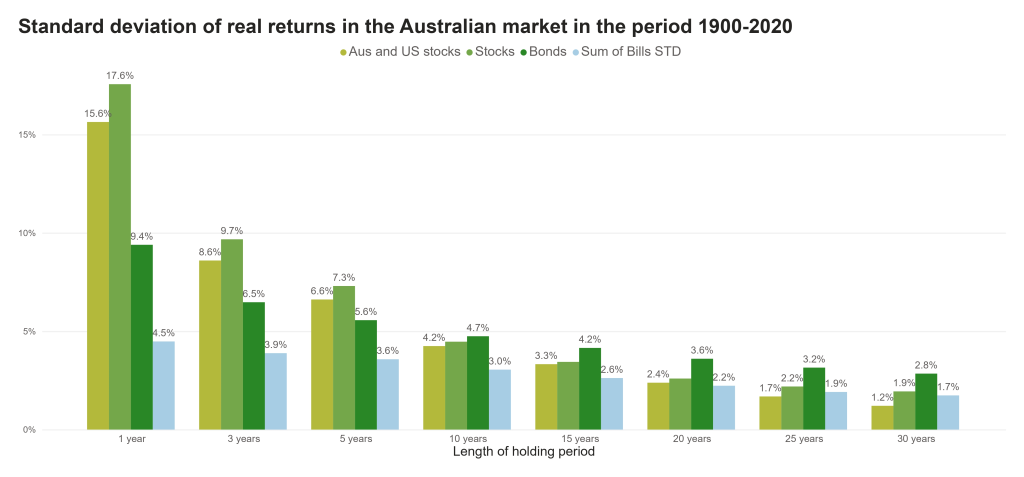
Not only does 50% US and 50% Australia overall have a smaller standard deviation than 100% Australia, but it even has a smaller standard deviation than Australian bills over 30-year holding periods.
Below is the graph for maximum and minimum annualised real returns:
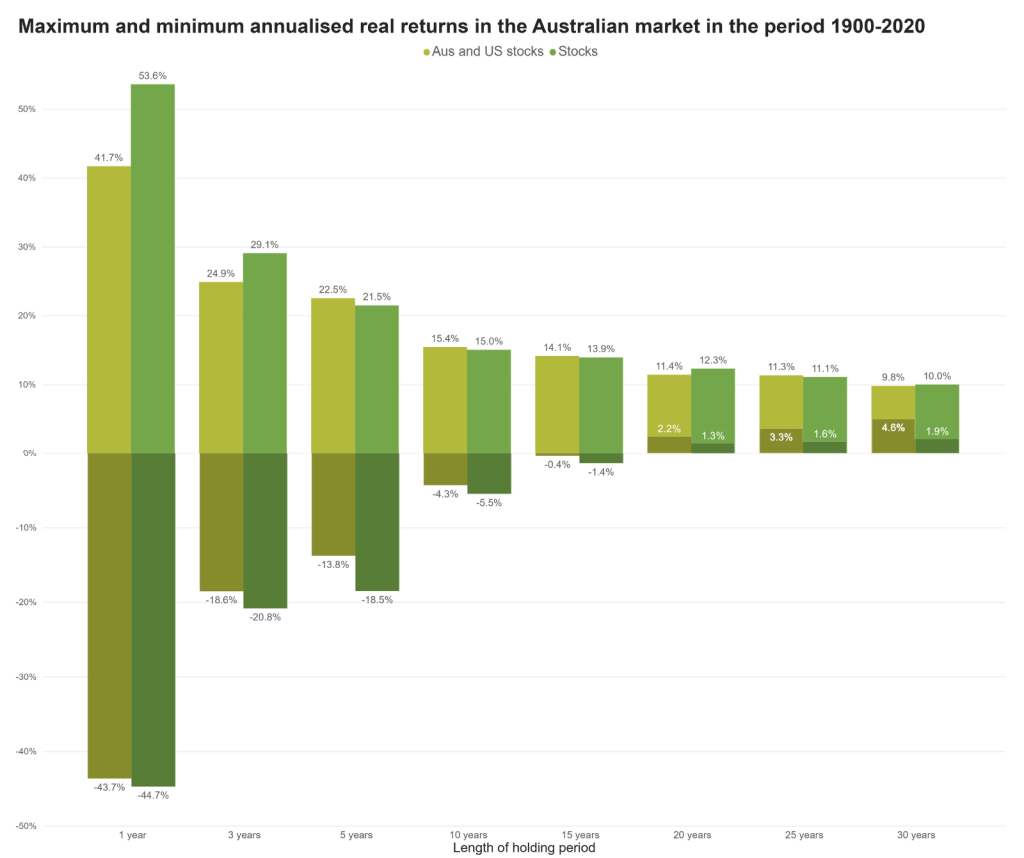
Although the maximum returns over 1-year periods are lower, the range of returns for 30-year holding periods is significantly smaller.
This also plays a big role in reducing the range of total returns:
Conclusion
It is important to understand that the performance of stocks is unpredictable, even over long time horizons. Despite that, stocks still play an important role in beating inflation over the long term whilst outperforming other asset classes like bonds and bills. From 1900 to 2020, the annualised real returns for the asset classes used in the analysis are:
- Stocks (100% Australian market): 6.37%
- Stocks (50% Australian market and 50% US market): 6.95%
- Bonds: 1.62%
- Bills: 0.96%
Now, if someone knows nothing about investing, they’re likely to rely on media depictions of the stock market main involving stock picking and trading. In the next article, I show the academic evidence against these strategies: The academic evidence against stock picking & trading
References
Òscar Jordà, Moritz Schularick, and Alan M. Taylor. 2017. “Macrofinancial History and the New Business Cycle Facts.” in NBER Macroeconomics Annual 2016, volume 31, edited by Martin Eichenbaum and Jonathan A. Parker. Chicago: University of Chicago Press.
Òscar Jordà, Katharina Knoll, Dmitry Kuvshinov, Moritz Schularick, and Alan M. Taylor. 2019. “The Rate of Return on Everything, 1870–2015.” Quarterly Journal of Economics, 134(3), 1225-1298.
