What Australian/International allocations should you choose?
A decision everyone needs to make when choosing a DIY portfolio, either in super or outside of super, is how much one should allocate to the Australian market vs the International market. There are number of factors and potential biases one should consider before deciding on the degree of home bias. One of these factors includes considering the optimal allocations. Mukherjee (2016) considers three types of models in estimating the optimal allocations:
- Capital Asset Pricing Model (CAPM): assuming market-cap weightings to be the optimal allocations, market-cap weightings are the proportion of a country’s market size in relation to the world’s market size. For Australia, this is roughly 2%. However, the restrictive assumptions of the CAPM, such as information symmetry and disregarding transaction costs, make this unrealistic in practice.
- Mean-variance optimisation: using historical data to calculate optimal weightings. This approach makes it hard to get a reliable estimate as results can vary wildly with different start and end dates.
- Mixed modelling: addresses the limitations of CAPM and mean-variance, where an increasing mistrust of CAPM results in weightings closer to mean-variance but with more reliability.
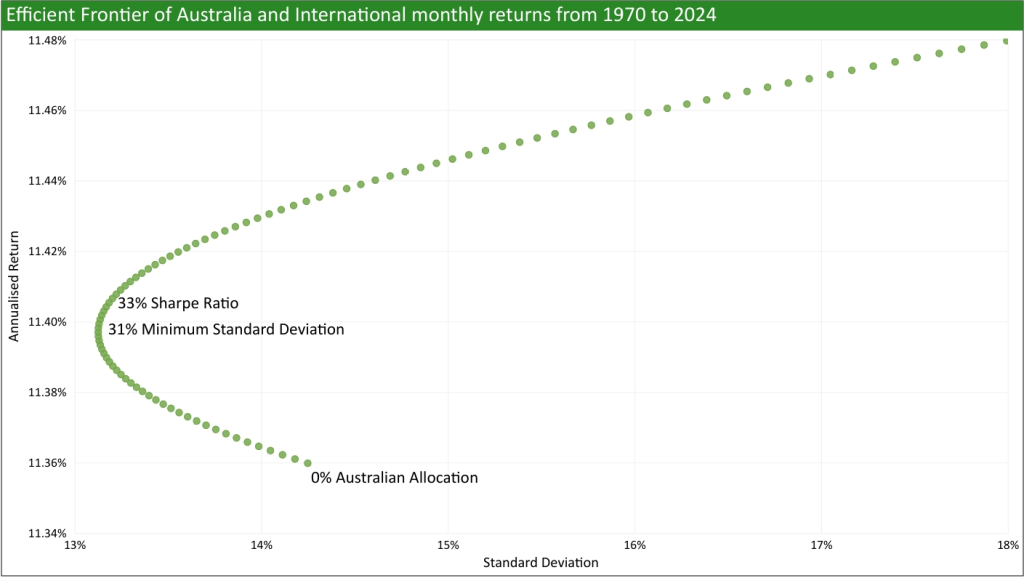
In this article, I’ll be using the efficient frontier model to calculate the mean-variance optimal allocations. Note that the model has limitations that may not accurately represent the real world. For the model, I took the data from Vanguard Chart and manually entered it into this spreadsheet, which contains monthly returns from 1970 to 2024.
The below chart shows that over the entire period, I found that a 31% Australian allocation gave the lowest standard deviation, and a 33% Australian allocation gave the highest Sharpe ratio (estimated risk-free rate over the period was 7%). The data does not include franking credits. Klement, Greenrod, and O’Neil (2013) finds franking credits bumps up the optimal allocation by 20% to 30% from their analysis using 1970 to 2012 data. To provide further credence, Anarkulova, Cederburg and O’Doherty (2025) found a very similar result of 33% domestic stocks being optimal based on their methodology and data (39 developed countries totalling around 2500 years of sample data). The authors do note that a home bias of 10% to 55% performs reasonably closely to the optimal 33% allocation.
However, it should be noted that the optimal Australian allocation for minimum volatility varies throughout history. This can be seen in the chart below, where it shows the minimum standard deviation across time with varying rolling periods (e.g., for rolling 10 years, I would calculate the minimum standard deviation from Jan 1970 to Dec 1979, then Feb 1970 to Jan 1980, all the way to Jan 2014 to Dec 2024). The dotted lines represent the average minimum standard deviation for the respective rolling period (e.g., 38% Australia was the average minimum standard deviation for rolling 10 years).
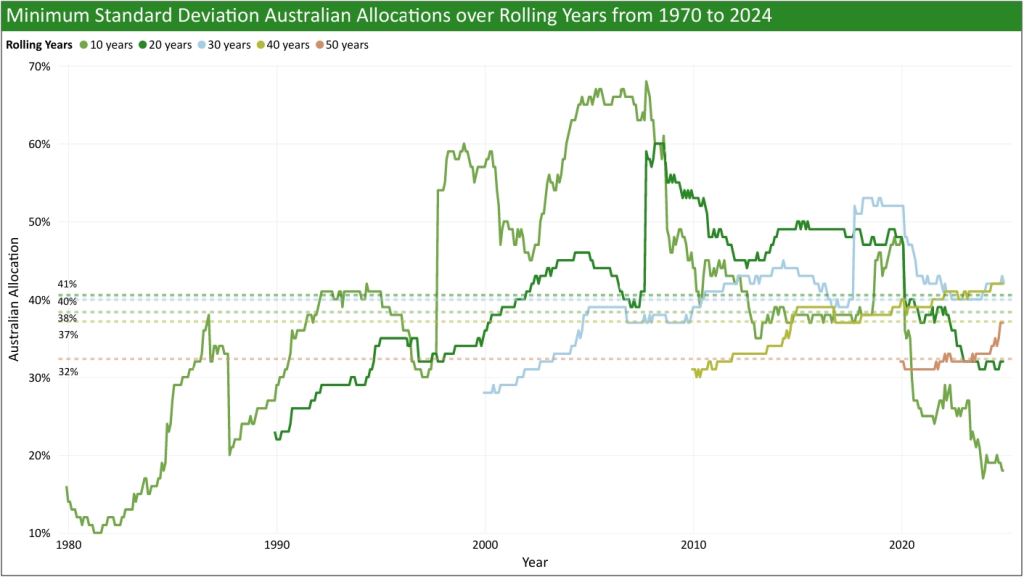
There is significant variation for 10-year rolling returns, going as low as 10% Australia and as high as 68% Australia, but the range narrows between 30% and 42% for rolling 40 years and rolling 50 years.
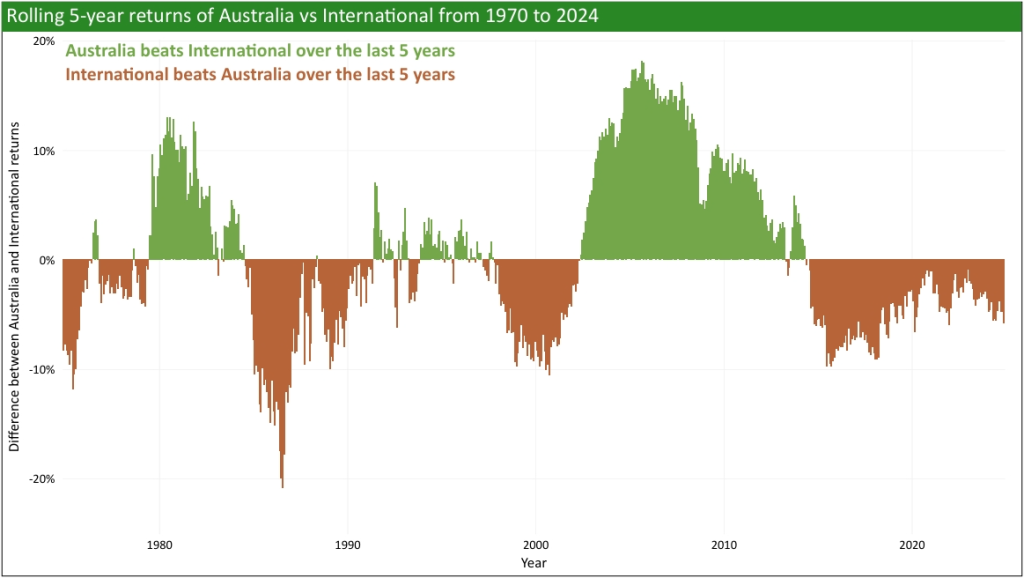
The optimal allocation changes throughout time because the Australian market and International market take turns outperforming each other, creating a diversification benefit. This is illustrated in the chart below:
As I mentioned at the start, there are number of factors and potential biases to consider when deciding on Australian/International allocations. Other factors to consider when deciding how much to allocate towards Australia include:
- Concentration risk: the Australian market has high sector concentration in Financials and Materials. The top 10 Australian companies also make up roughly 45% of the ASX/S&P 300 as at 31 August 2023.
- Cost: A200/IOZ/VAS is cheaper than VGS/BGBL.
- Personal tax rate: franking credits and the high distribution yield of the Australian market is seen more favourably with a low tax rate and less favourably with a high tax rate.
- Other diversification sources: Including additional asset classes, such as emerging markets, such that it reduces the need to use Australia as a diversifier.
Some behavioural biases to be aware of, listed by Ardalan (2018), include:
- Familiarity: feeling comfortable with investing in companies they know and see.
- Regret: investors who use their home market as the benchmark could suffer from regret if they see the international market doing poorly.
- Overconfidence: the perception of having an information advantage relative to foreign investors.
- Competency: investors that believe they are more competent with home equities than international equities.
- Optimsim and patriotism: the belief that home equities will perform better than international equities or as a way to support their country’s economy.
Youtuber Ben Felix further dives into the acadmeic evidence for having a home bias: Is Home Country Bias a Mistake?
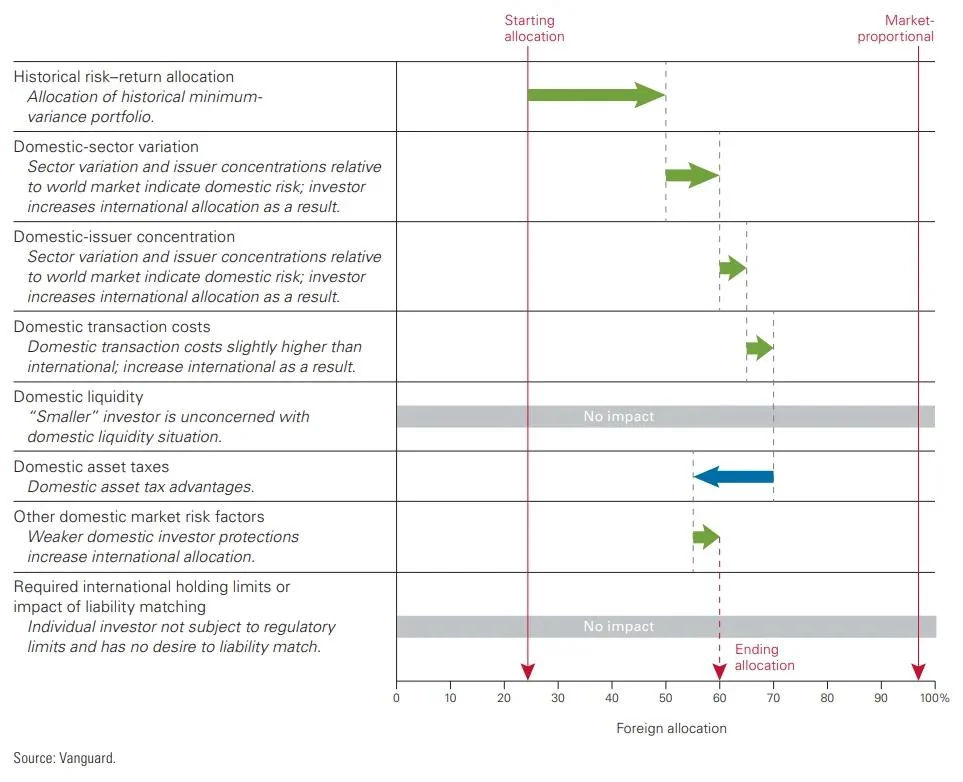
The Vanguard paper, The Role of Home Bias in Global Asset Allocation Decisions, considers the thought process of a hypothetical investor deciding on 40% Australia.