
A modern approach to bonds
Preparing for retirement: Part 1 of 3
Investing is easy. There is an initial stage of learning how to invest. But once you’ve settled on a portfolio and are aware of common behavioural pitfalls, you can invest on autopilot for years or even decades. Eventually, you hope to build a large enough portfolio to fund part or all your spending. However, unlike the investing phase, drawing from your portfolio is significantly more complicated.
Using ERN’s analogy, investing is as easy as paddling a canoe downstream. You can paddle (invest) at your leisure, and how hard you paddle depends on how soon you want to reach your goal. Drawing from your portfolio is like paddling upstream, making it a test of endurance. If you are not deliberate in how you pace your strokes, you run the risk of exhausting yourself before the finish line. On the flipside, you could paddle too conservatively and not achieve as much as you wanted to by the end.
To provide clarity on this pivotal stage of the investing journey, I’ve broken down this topic into three parts (subject to change):
- How bonds work and which ones to choose,
- Asset allocation and spending rules, and
- Putting all the theory into practice.
This will unfortunately be a long, dense article. But to get a complete picture, I will talk about the following:
What are bonds?
Bonds are loans that an investor can make to an entity. The entity will then pay the investor interest, known as coupons. At the maturity date, the entity pays back the loan to the investor, known as the principal.
Bonds are known as a fixed income asset class by providing certainty on the stream and the schedule of future cash flow, helping to reduce the risk of a portfolio (Brask, 2021).
Non-rolling ladder vs rolling ladder
To understand what a bond ladder is, we need to first understand duration. For a bond, duration is simply when the bond matures. For example, say the year is 2025 and you buy a bond that matures in 2030, then the duration of that bond is 5 years. Next year the duration will decline to 4 years and continue declining until the bond matures. If you have a portfolio of bonds, then you can simply calculate the average duration of the portfolio. For example, 50% in a 5-year duration bond and 50% in a 10-year duration bond give an average duration of 7.5 years.
So, a non-rolling ladder is a portfolio of bonds where the average duration declines to zero. A rolling ladder is a portfolio of bonds that does not allow the duration to decline to zero. A rolling ladder typically targets a certain duration through buying and selling bonds.
Now, which type of ladder should be used?
For most investors, a non-rolling ladder is the most attractive for removing uncompensated interest rate risk (Matthew, 2021). Summarising vineviz’s 2021 post: A bond duration glide path for retirement investing, the closest we can get to a riskless portfolio over a time horizon of T years is to have a bond portfolio that also has an average duration of T years.
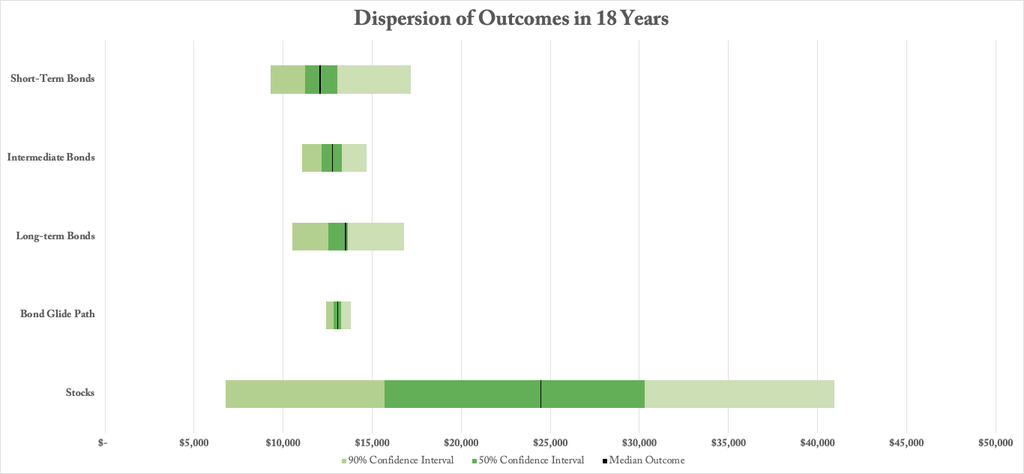
Vineviz demonstrates this by assuming a time horizon of 18 years and simulating possible future paths for:
- Short-term bonds (rolling ladder),
- Intermediate bonds (rolling ladder),
- Long-term bonds (rolling ladder),
- The bond glide path (non-rolling ladder) with a starting duration of 18 years, and
- Stocks.
The chart below shows that after 18 years, the bond glide path had the smallest range of potential outcomes because the duration matched the time horizon. Matthew (2021) also supports the use of duration matching through their own analysis. Intermediate bonds had the second smallest range in the chart because their average duration was the next closest to 18 years.
A rolling ladder only makes sense if your time horizon is uncertain. However, the time horizon is reasonably predictable for retirees. If you’re an Australian retiring before 60, you know exactly how many years you have before being able to access your super at 60. When you’ve accessed your super, you can approximate your time horizon based on your estimated life expectancy. I will expand on this in parts 2 and 3.
Individual bonds vs bond funds
You can invest in bonds in two different ways. You can either:
- Directly buy individual bonds, or
- Buy bond funds that hold a basket of different types of bonds and durations.
So, what’s the difference? Assuming the same type of bond, a portfolio of individual bonds will have the same performance as a bond fund if they have the same average duration.
The key difference between the two is how their average duration behaves:
- Buying individual bonds all at once is a non-rolling ladder, and so the average duration will naturally decline if left alone. However, you can achieve a rolling ladder by simply buying more individual bonds using coupons, principal, and other income.
- A bond fund will typically target an average duration, acting like a rolling ladder. However, you can mimic a non-rolling ladder by using multiple bond funds with different average durations. For example, say there is a hypothetical bond fund with a 20-year average duration called 20BOND and a 5BOND fund that averages 5 years. You can allocate 35% to 20BOND and 65% to 5BOND to get an average duration of around 10 years. You can then increase the allocation towards 5BOND to decrease the average duration of the portfolio.
Since you can get similar outcomes by either using individual bonds or bond funds, there are two main considerations when deciding between the two:
- Cost – Individual bonds tend to have higher bid/ask spreads but no ongoing cost. Bond funds typically have lower bid/ask spreads but a management fee deducted from their returns.
- Convenience
- The easiest way to build a non-rolling ladder is to buy individual bonds all at once. This also gives more certainty as you can plan exactly how much income you’ll receive each year. A non-rolling ladder using bond funds is only possible if you have both a long-duration fund and a short-duration bond fund to adjust your ladder’s duration. You would also need to rebalance periodically to reduce the average duration.
- You can easily achieve a rolling ladder with a bond fund. A rolling ladder using individual bonds requires more work because you need to constantly buy more bonds.
For further reading: Individual bonds vs a bond fund – Bogleheads.
Types of bonds
The three most common types of bonds are:
- Corporate bonds issued by corporations. They come in many different forms, like floating rate bonds, senior and subordinated bonds, hybrids, and credit.
- Government bonds, also known as treasury bonds. Bonds not linked to inflation are called nominal bonds.
- Inflation-indexed government bonds. These bonds that trade on the ASX are called eTIBs (exchange-traded Treasury Indexed Bonds). In the US they are referred to as TIPS (Treasury Inflation-Protected Securities).
Bonds are more risky than cash because of:
- Interest rate risk (also known as duration risk or term risk) – changes in interest rates are inversely related to bond prices. If the interest rate rises, the price of bonds falls because the rate at which the bonds were issued is now lower than the current rate. Conversely, if the interest rate falls, the price of bonds rises. This risk is greater the longer the duration of the bond is. For example, if the interest rate rises by 1%, a 5-year bond will fall by roughly 5% while a 10-year bond will fall by roughly 10%.
- Inflation risk – changes in inflation affecting the real value of coupon payments and principal.
- Default and credit risk – for corporate bonds, the risk of defaulting and being unable to pay back investors their coupons or principal. Credit risk is how likely the corporation is to default.
So, which type of bond should you consider?
Corporate bonds
The main reason for including bonds in a portfolio is to provide a safety net while stocks provide the long-term growth. Therefore, corporate bonds would be ill-suited for this job because of the additional default and credit risk compared to government bonds. Swedroe and Berkin (2016) detail why this additional risk is problematic:
- The default premium (the extra return to compensate for the added risk) has been historically weak, averaging 0.3% annually in the US from 1927 to 2015, with the premium being statistically insignificant.
- Corporate bonds have higher fees, eroding the already small premium.
- Although diversification across corporate bonds can reduce default and credit risk, you can avoid those risks by using government bonds instead.
- Part of the risk can be attributed to equity risk, so corporate bonds can be thought of as a hybrid between stocks and government bonds. However, you’ll probably get a more efficient return/risk profile by allocating a mixture of stocks and government bonds instead. You could apply factor investing to corporate bonds, but again, it’ll probably be more efficient to apply factor investing to stocks.
Nominal government bonds
Nominal (not inflation-adjusted) government bonds have been the staple safe asset for decades, used in prominent retirement papers like Bengen (1994) and have become embedded into retirement accounts across the globe. The tenet that nominal bonds are safe was seriously questioned by Cederburg, Anarkulova, and O’Doherty (2026) in their paper: Beyond the Status Quo: A Critical Assessment of Lifecycle Investment Advice.
Ben Felix discusses the paper in his video: The Most Controversial Paper in Finance. Ben also interviewed Cederburg about the paper in episodes 284, 350, and ___ (Ben plans to do a final interview), and Cederburg gave a video presentation here.
The headline finding of the paper is that 100% equities (34% domestic stocks and 66% international stocks) was optimal for both accumulation and retirement. One of the breakthroughs this paper made was to include the long-run properties of assets, something that most other papers have neglected. By including long-run properties of assets, nominal bonds (both domestic and international) that looked safe in the short term suddenly become unattractive over long horizons. This is relevant for retirees who need a portfolio that can sustain them for potentially 20-30+ years.
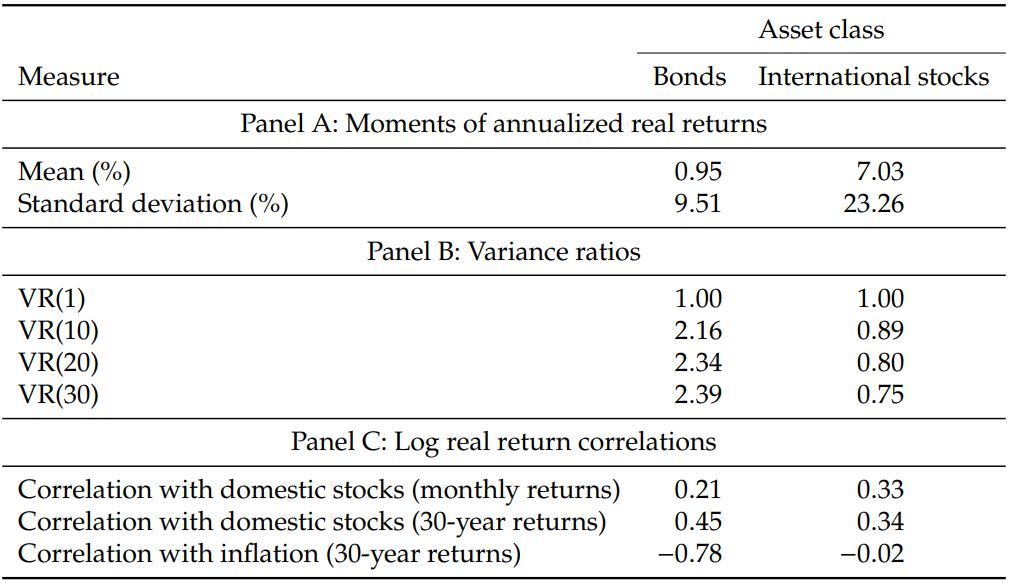
Table I from the paper shows the likely reasons why nominal bonds aren’t attractive to long-term investors:
- Bonds had a low real return of 0.95%.
- The 30-year variance for bonds is 2.39 times the 1-year variance, indicating mean aversion (lower returns tend to be followed by lower returns). For international stocks, the 30-year variance is 0.75 times the 1-year variance, indicating mean reversion (lower returns tend to be followed by higher returns). For long-term investors, mean reversion helps reduce risk whereas mean aversion increases volatility.
- Although bonds had a low correlation of 0.21 to domestic stocks for monthly returns, this increased to 0.45 for 30-year periods. For international stocks, their correlation with domestic stocks decreased to 0.34 for 30-year periods. Keep in mind that the correlation between domestic and international stocks is likely to be higher moving forwards, weakening (but not removing!) the diversification benefit of international stocks.
- Bonds have a high negative correlation with inflation over 30-year periods, so when inflation is high, bond returns tend to be low. But international stocks have almost zero correlation, making them a better hedge against long-term inflation than bonds.
Make no mistake, 100% stocks are still risky. Stocks were more volatile and had the largest median drawdown of -52% compared to portfolios that held cash or nominal bonds. But cash and nominal bonds were even riskier over long horizons. To quantify the opportunity cost of cash and nominal bonds, the authors calculate the equivalent annual fees relative to the optimal portfolio shown in the table below. For example, having 10% in cash is equivalent to the optimal portfolio + an annual fee of 0.43%.
| Allocation | Cash | Bonds |
|---|---|---|
| 10% | 0.43% | 0.31% |
| 20% | 0.91% | 0.68% |
| 30% | 1.44% | 1.10% |
| 40% | 2.00% | 1.56% |
But the wrong conclusion to take from the paper is that investors should always have 100% equities in their portfolio. Rather, nominal bonds and cash are unattractive over long time horizons, and the paper emphasising the importance of having international stocks. Assets not included in the paper could still make sense for retirees. One such asset could be indexed bonds.
Inflation-indexed government bonds
Australia started issuing indexed bonds in 1985, yet they still only accounted for around 5% of total debt (RBA, 2024). Despite how underutilised indexed bonds are, the literature strongly supports investors whose expenses are affected by inflation having a strong preference for indexed bonds over nominal bonds. Illeditsch (2016) would go so far as to say that investors should have net-zero allocation towards nominal bonds and cash because they carry residual inflation risk, the risk that inflation affects their real cash flows. Illeditsch then proves that this risk is uncompensated, and it can be avoided with indexed bonds.
Given how unpopular indexed bonds are despite the evidence for their use, Lioui and Tarelli (2023) propose that this blindness to indexed bonds stems from the money illusion. Branger, Cordes, and Langer (2024) define the money illusion as a “tendency to evaluate economic transactions in nominal rather than real terms”, or in other words, “inflation ignorance”. Money illusion is not only harmful in hyperinflation environments but also low-inflation environments, as investors wrongly associate low inflation rates with low inflation risk (Lioui and Tarelli, 2023).
To be clear, think of indexed bonds like insurance that hedges against unexpected inflation. Expected inflation is already reflected in bond prices. You can even calculate the market’s expectation of inflation by taking the difference in the nominal yield of a nominal bond and the real yield of an indexed bond. Yield in this context is yield-to-maturity (YTM), the annualised yield you would earn if you bought the bond that day and held it to maturity.
For example, on 6/11/2026, market sentiment on the average annual inflation using bonds that mature in 2032 is:
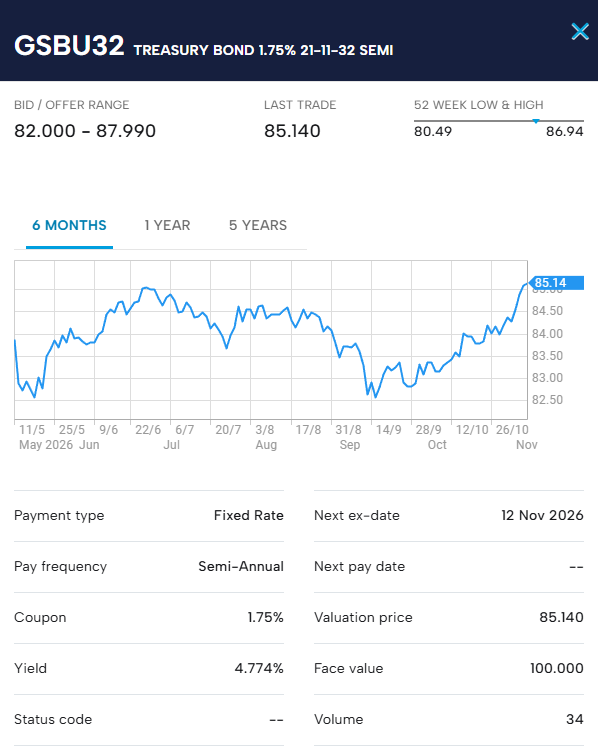
- Nominal yield of nominal bond (GSBU32): 4.60%
- Real yield of indexed bond (GSIU32): 2.34%
- Breakeven inflation: 4.60% – 2.34% = 2.26%
Working out
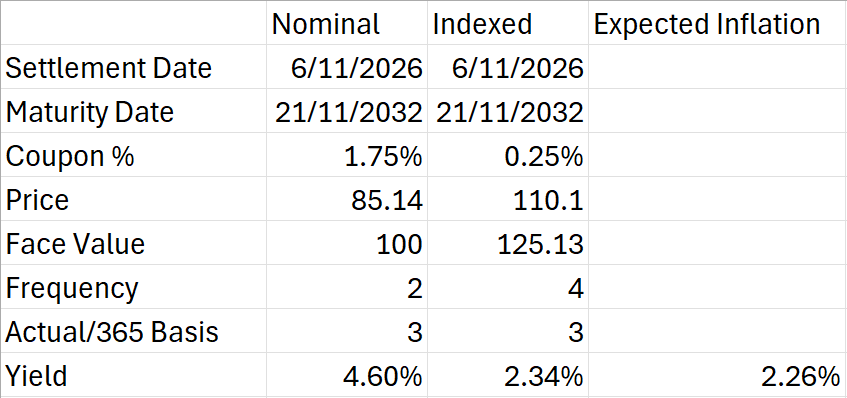
Price and face value taken from ASX – Government Bonds:
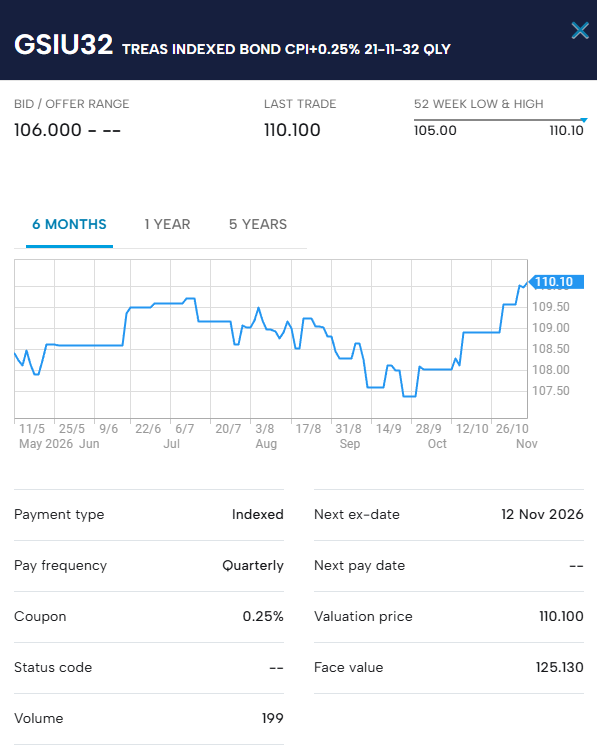
If actual inflation is higher than breakeven inflation, then indexed bonds outperform nominal bonds. If it is lower, then nominal bonds outperform.
There are some risks to keep in mind for indexed bonds:
- Liquidity issues when buying and selling.
- Changes in law, regulation, and policy.
- The CPI adjustment that applies to the indexed bond may not accurately reflect your personal inflation rate.
- The Australian Government can halt trading in eTIBs on the ASX (Australian Government, 2025).
- Payments can be affected by deflation, noting that:
- eTIBs have a “deflation guarantee” by setting a floor on the principal so that it cannot go below its starting price of $100. Coupons also have a floor, but losses are offset through deductions from future coupons or principal (Australian Government, 2015).
- “As long as there is cumulative inflation between the date you purchase the bond and the date the bond matures, and you hold the bond to maturity, the actual real Yield to Maturity (YTM) will match the real YTM quoted at the time of the purchase” (Sit, 2022).
- Long-term deflation is rare and is more likely to only last a few months (Tipswatch, 2024). But in the end, unexpected inflation is more concerning than unexpected deflation.
For further reading: eTIBs by conwy.
Fixed income alternatives
You can substitute your bond allocation with the following:
- Job income:can be nominal bond-like or even indexed bond-like if you’re lucky. This would appeal to those who do not wish to fully retire and instead reduce their hours, go part-time, and/or switch to a less-demanding job. Be aware that some jobs may be stock-like if there’s a risk of being let go in an economic downturn.
- Age pension: only relevant if you meet the eligibility requirements.
- Paid-off house: reduces your expenses by not needing to pay down a mortgage or make rent payments, allowing you to increase your willingness to take risks. However, you should not include your home equity as part of your portfolio unless you plan to do something like a downsizer contribution. For more details, refer to Renting vs. Buying a Home: The Case for Owning.
- Cash in a HISA or Offset: could be used as a short-term hedge against unexpected inflation, as rates usually (not always) rise when inflation increases.
What isn’t a suitable fixed income alternative is any kind of high-dividend investment because of its exposure to equity risk. After all, income is irrelevant when it’s the total return that matters, and the total return of equities is volatile in the short term. The dividend yield is also unpredictable and may not keep up with inflation. The worst examples of these investments are covered call ETFs that are known to be the devil’s bargain and private credit ETFs whose attractive 10%+ yields come at the cost of high equity and illiquidity risk (refer to The Problem with Private Markets).
Conclusion
To recap:
- Bonds provide a known stream and timing of future cash flow.
- A duration-matched, non-rolling ladder gives the most certainty about what you will receive at a certain time horizon.
- Duration matching is easiest with individual bonds but can be done with bond funds.
- Use government bonds to avoid default and credit risk from corporate bonds. Further use indexed bonds to avoid residual inflation risk.
- Job income, age pension, and a paid-off house can help reduce the bond allocation. HISA/Offset can be used as a substitute in the short-term.
What’s the main purpose of bonds? Most people will say it’s to reduce portfolio volatility or provide protection in a market crash. I’d argue that its purpose is to provide a spending floor to reduce income volatility. I’ll go into detail on why I make this distinction in part 2 of preparing for retirement: (next article sometime in 2027).