
Passive Emerging Market ETFs for Australians
Emerging markets is around 10% – 15% of the world’s market-cap. Because it is such a small portion of the world, this exposure is often considered optional for those building a DIY portfolio. For those interested in adding this exposure, what are some things to keep in mind?
Diversification
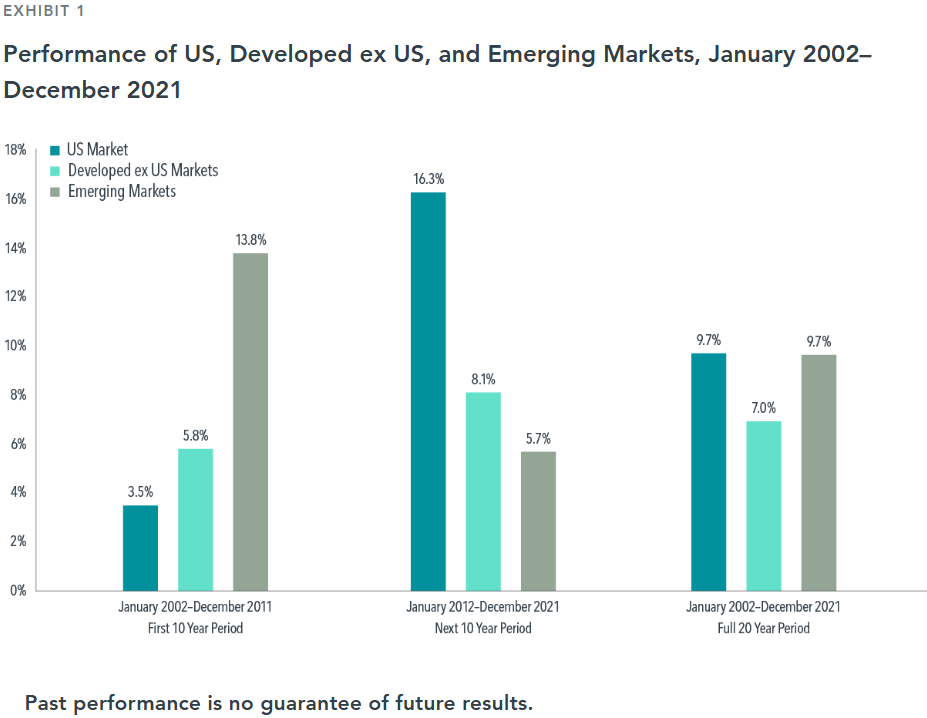
Emerging markets provide lower correlation from not being fully integrated into the global market (Beach, 2006; Camilleri and Galea, 2009; Gupta et al., 2017). This is evident when looking at the last couple decades of performance, where the below chart from DFA shows emerging markets outperforming in the 2000s but underperforming in the next decade.
Higher risk
Karolyi (2015) defines 6 types of risk that emerging markets tend to be highly exposed to:
- Market capacity constraints; the market’s ability to fund growth.
- Operational inefficiency that makes trading costly or restrictive.
- Foreign accessibility restrictions, such as withholding taxes.
- Corporate opacity, dictating how fair and accessible company information is.
- Limits to legal protections for investors.
- Political instability
It is because of these risks that emerging markets have historically had more severe drawdowns compared to developed markets. For the countries within emerging markets, they tend to be more susceptible to catastrophic losses, extreme volatility, or poor return/risk. This can be alleviated by being broadly diversified across all emerging markets (Beach, 2006; Estrada, 2008).
Naturally, you would expect some compensation of higher returns to take on the higher risk of emerging markets. However, don’t mistake high expected GDP growth as a reason to expect higher returns, as Hsu et al. (2022) find no correlation between real per capita GDP growth and stock market returns in emerging markets.
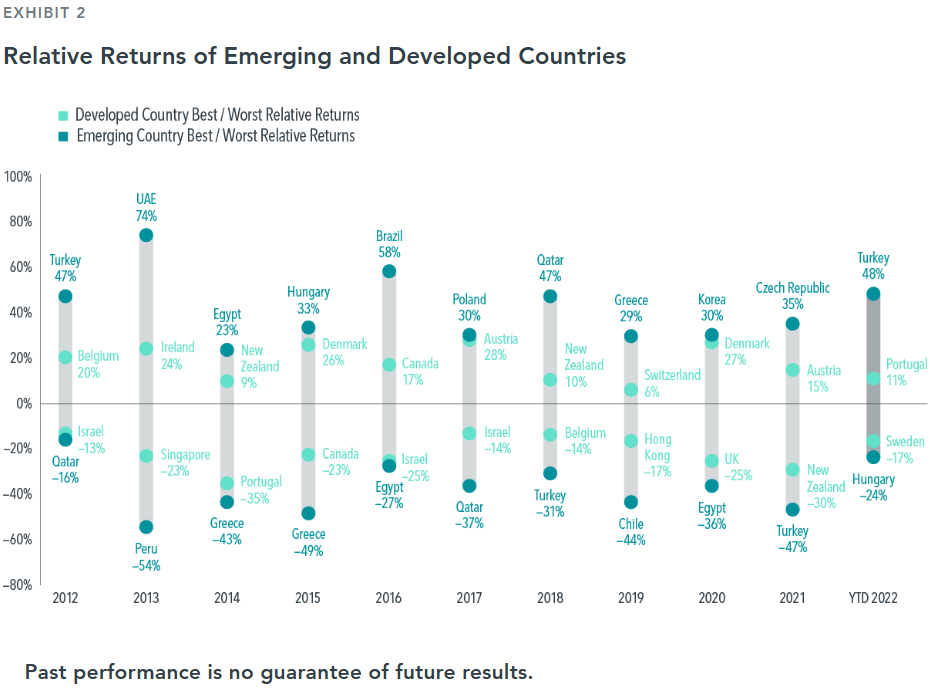
The below chart from DFA illustrates the highest and lowest returning countries from emerging markets and developed countries, showing how emerging countries are more risky with their higher highs and lower lows and emphasising the need to be diversified across emerging markets.
Tracking difference and tracking error
Tracking difference is the return difference between the fund and the benchmark, while tracking error measures the volatility of the tracking difference, in other words, its tracking consistency (Charteris and McCullough, 2020). Why should we care about tracking error? Charteris and McCullough further elaborate that while passive investors care about the tracking difference to evaluate the fund’s performance, “(tracking error) is only of concern for long-term investors when they wish to disinvest (Vanguard, 2014; Bonelli, 2015).”
Stocks are much more volatile in emerging markets than developed markets, resulting in more tracking error when a portfolio’s weightings deviate from the index’s weightings (Blitz and Huij, 2012). Neto et al. (2021) also find emerging market funds have more tracking error compared to developed market funds, the tracking error in emerging market funds being more elevated during bull markets. Lastly, Miziołek and Feder-Sempach (2019) find tracking error to be higher in emerging markets than developed countries, but they make an additional distinction that EM ETFs that used synthetic replication generally had less tracking difference and error than physical replication.
Synthetic replication
To sidetrack what synthetic replication is, specifically for European-domiciled ETFs known as UCITS, this information applies to the ETF BEMG. To give a quick version of what synthetic replication is, they can perfectly match the performance of an index before costs, tend to be less costly and have less tracking error, but come at the cost of adding counterparty risk that can affect the performance if the counterparty defaults. For those interested in more details, the below information comes from Bevza and O’Hagan Luff’s (2026) paper, Structural challenges of synthetic ETFs domiciled in Europe.
Open for more details…
Synthetic replication uses total return swaps with counterparties to match the performance of the index. This differs from the more common physical replication which directly holds all the companies in the index. Synthetic replication tends to be less costly and with less tracking error, especially in less liquid markets like emerging markets.
Although tracking error is theoretically zero when using total return swaps, synthetic ETFs do still get tracking error because of management fees, swap spreads, and other costs. The downside to synthetic replication is being exposed to the risk of the counterparty defaults on the swaps. However, synthetic ETFs can hold a collateral basket to protect investors in the case of a default. For synthetic ETFs that track emerging markets, the collateral basket is often developed market stocks that are more liquid and less costly to trade. It is also common for synthetic UCITS ETFs to have multiple counterparties (usually around five) to reduce the impact of one counterparty defaulting.
The authors elaborate further on how Europe regulates synthetic ETFs:
Since the GFC, the use of synthetic ETF structures has decreased globally due to increased concerns about counterparty default risk, but European regulators have introduced controls to alleviate these risks (Central Bank of Ireland, 2017; Cullen, 2021). In Europe, most ETFs are guided by the UCITS legislation (2009/65/EC). The UCITS directive, reinforced after the GFC, mandates that synthetic ETFs restrict exposure to any single total return swap counterparty to 10% of the fund’s Net Asset Value (NAV), provided the counterparty is a major European credit institution. This requirement ensures that the collateral basket, which is marked-to-market daily, remains at least 90% of the NAV, thereby limiting potential losses to investors in the event of counterparty insolvency. Swaps are reset to adjust the value of the collateral basket, thereby mitigating the credit risk and protecting investors (Chovancová, et al., 2019).
Passive Emerging Market ETFs
Because it is important to be diversified across emerging markets as I’ve stated previously, I will only be comparing reasonably diversified ETFs in the below comparison.
| BEMG | VGE | VAE | IEM | EMXC | WEMG | |
|---|---|---|---|---|---|---|
| Management Expense Ratio (MER) | 0.35% | 0.48% | 0.40% | 0.69% | 0.25% | 0.35% |
| Estimated Total Cost at 32% tax rate* | 0.71% | 1.91% | 0.70% | 1.57% | 1.10% | 1.08% |
| Assets Under Management (AUM) | $50.76 M | $1.76 B | $731.53 M | $1.51 B | $388.89 M | $30.36 M |
| Underlying holding | Amundi Core MSCI Emerging Markets Swap UCITS ETF Acc (LEMA) | Ireland-domiciled | 0.14% MER | Vanguard FTSE Emerging Markets ETF (VWO) | US-domiciled | 0.06% MER | Vanguard FTSE Asia ex Japan Shares Index ETF [Directly holds securities] | iShares MSCI EM UCITS ETF USD Dist (IEEM) | Ireland-domiciled | 0.18% | iShares MSCI EM ex-China UCITS ETF Dist (EXCD) | Ireland-domiciled | 0.18% | State Street® SPDR® S&P® Emerging Markets Carbon Aware ETF [Directly holds securities] |
| Replication | Synthetic | Representative sampling | Full replication | Full replication | Full replication | Representative sampling |
| Inception date | 22/08/2025 | 18/11/2013 | 09/12/2015 | 07/04/2003 | 07/06/2024 | 11/11/2013 |
As at 1 April 2026
Notes
BEMG
- The underlying holding is an accumulating ETF, meaning that it reinvests its dividends into the fund with the aim of not creating a taxable event for the investor. However, the UK, Austria, and Switzerland are examples of countries where investors still have to pay tax on the reinvested dividends. The tax treatment of accumulating ETFs in Australia is currently unknown given how new these options are. Another small benefit to accumulating ETFs is that they may have less tracking error than distributing funds, as they’re immediately able to reinvest income received (Feder‑Sempach and Miziołek, 2022).
- The underlying swaps use the MSCI Emerging Markets Net Total Return USD Index, where net return is the performance after taxes. MSCI calculates the net return performance by using the worst-case withholding tax and capital gain tax assumptions, resulting in slightly worse tax drag for BEMG compared to funds doing physical replication (fun fact: this is also the same reason why VGS and BGBL outperform their benchmarks, because the benchmarks assume worst-case 30% withholding tax from US dividends when the funds only actually do 15% because of our US tax treaty).
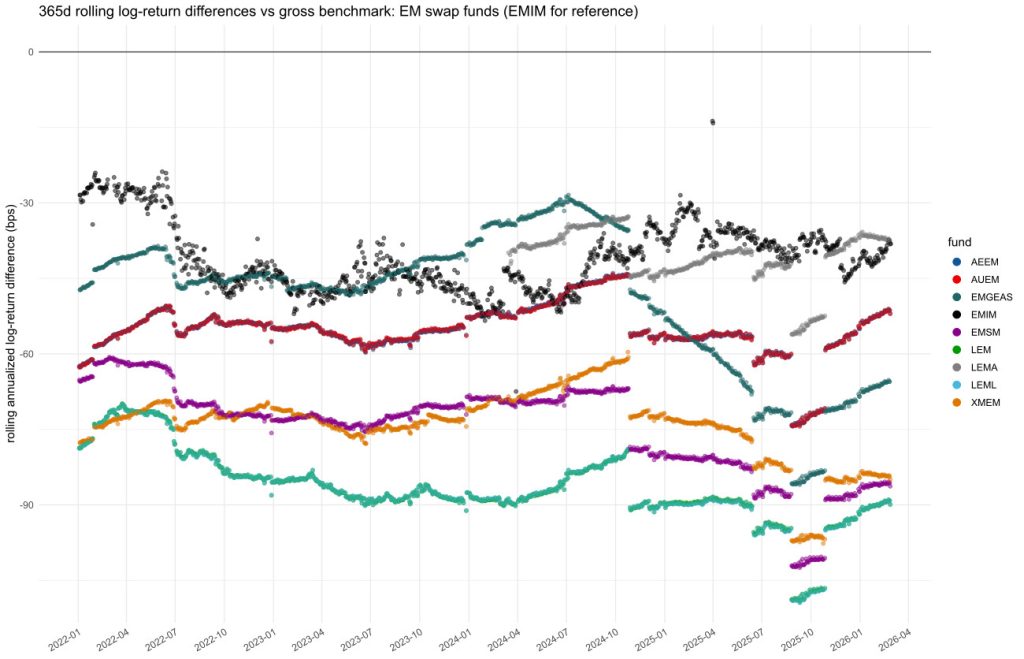
- Rational Reminder user glimz started the following thread Comparing index-replicating UCITS ETFs. They included the below image comparing synthetic emerging market ETFs from January 2022 to February 2026, showing LEMA (the ETF that BEMG holds) having one of the lowest tracking differences, as represented by the grey dots. EMIM, the black dots, is a physical replicating ETF shown as a reference.
VGE
- The ETF uses the FTSE index, which is a bit annoying because of differences in how index providers define what an emerging market is. For example, MSCI defines South Korea as an emerging market while FTSE doesn’t. This means that if you use VGS to get developed market exposure, you would be missing South Korea in your portfolio if you used VGE.
- The underlying ETF is US-domiciled, which is the worst kind of domicile for emerging markets when you can’t claim on withholding taxes and the US takes 15% of the dividends. This is why VGE has the worst after-tax cost. Ireland-domiciled is better because they don’t take 15% from the dividends, but of course directly holding the companies would be the best so that you can claim on withholding taxes.
VAE
- Because it only invests in Asian countries, the ETF is not a complete representation of emerging markets and has some slight overlap with VGS (overlaps on Hong Kong and Singapore). Based on market-cap weightings ending in December 2025, VAE gives exposure to around 80% of the emerging market universe based on MSCI definitions, but this could change in the future.