
Factor Regressions for Australian Funds
Factor regressions are used to estimate which factors drive a portfolio’s returns and by how much. Given there is no tool for Australians to calculate the factor regression of Australian-domiciled funds, I learnt to (hopefully correctly) calculate monthly factor regressions and have applied them to funds that I thought would be most interesting. Global Factor Premia is used to get Australian factor data while Fama French Data Library is used to get International and Emerging Markets data.
I do not claim to be an expert on interpreting factor regressions, and discussions like Interpreting Results of a F-F Five Factor Regression by Apeirox on the Rational Reminder Forum and other discussions helped me wrap my head around how to interpret these regressions. Below are some quick tips that I have collated:
- Factor regression is only a reflection of past factor exposures. A change in methodology recently or in the past may not be reflected in the regression (Vogel, 2018).
- Understanding the fund’s methodology can help provide context to regression results and whether the output makes sense (Gray, 2023). For example, multicollinearity may cause misleading results, which is the effect of factors having correlated periods that can skew results. Ben Felix provides an example here.
- How much factor exposure a portfolio has is more reliable the more diversified it is. So take regressions done on concentrated portfolios with more scepticism.
- Value and Investment are highly correlated (0.70 from 1953 to 2015, calculated by Sheth and Lim (2022)), so a regression may have trouble assigning exposures between the two.
- In this model, the p-value is the probability that we got an intercept value at least as extreme as what was calculated if the intercept was actually zero.
- p > 0.05 is not significant, and so we are not confident that the intercept is not 0, but this could also be a lack of data or the fund not targeting factors using Fama-French definitions.
- p <= 0.05 is statistically significant (*).
- p <= 0.01 has strong significance (**).
- p <= 0.001 has very strong significance (***).
- Alpha represents returns that cannot be attributed to the factors in the model. This can be caused by good/bad luck, idiosyncratic volatility that the model is unable to capture, or high fees. Alpha is expected to be close to 0 over the long term.
- When comparing the regressions between two or more funds, the time period should ideally be the same for a more accurate comparison. Keep that in mind when viewing the below tables with varying time periods.
- Do not take regression values at face value given their limitations, and so they should only be used to get a general idea of a fund’s factor exposures.
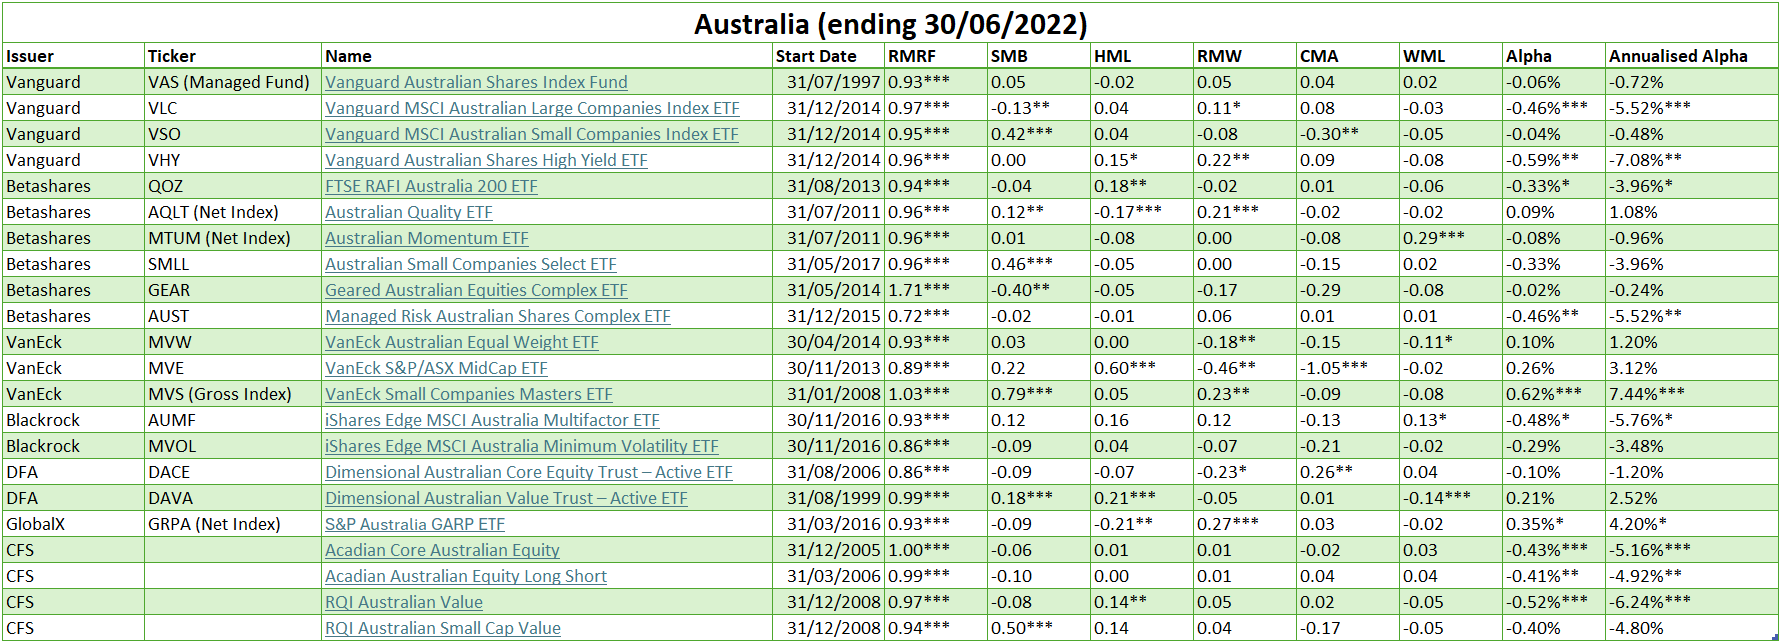
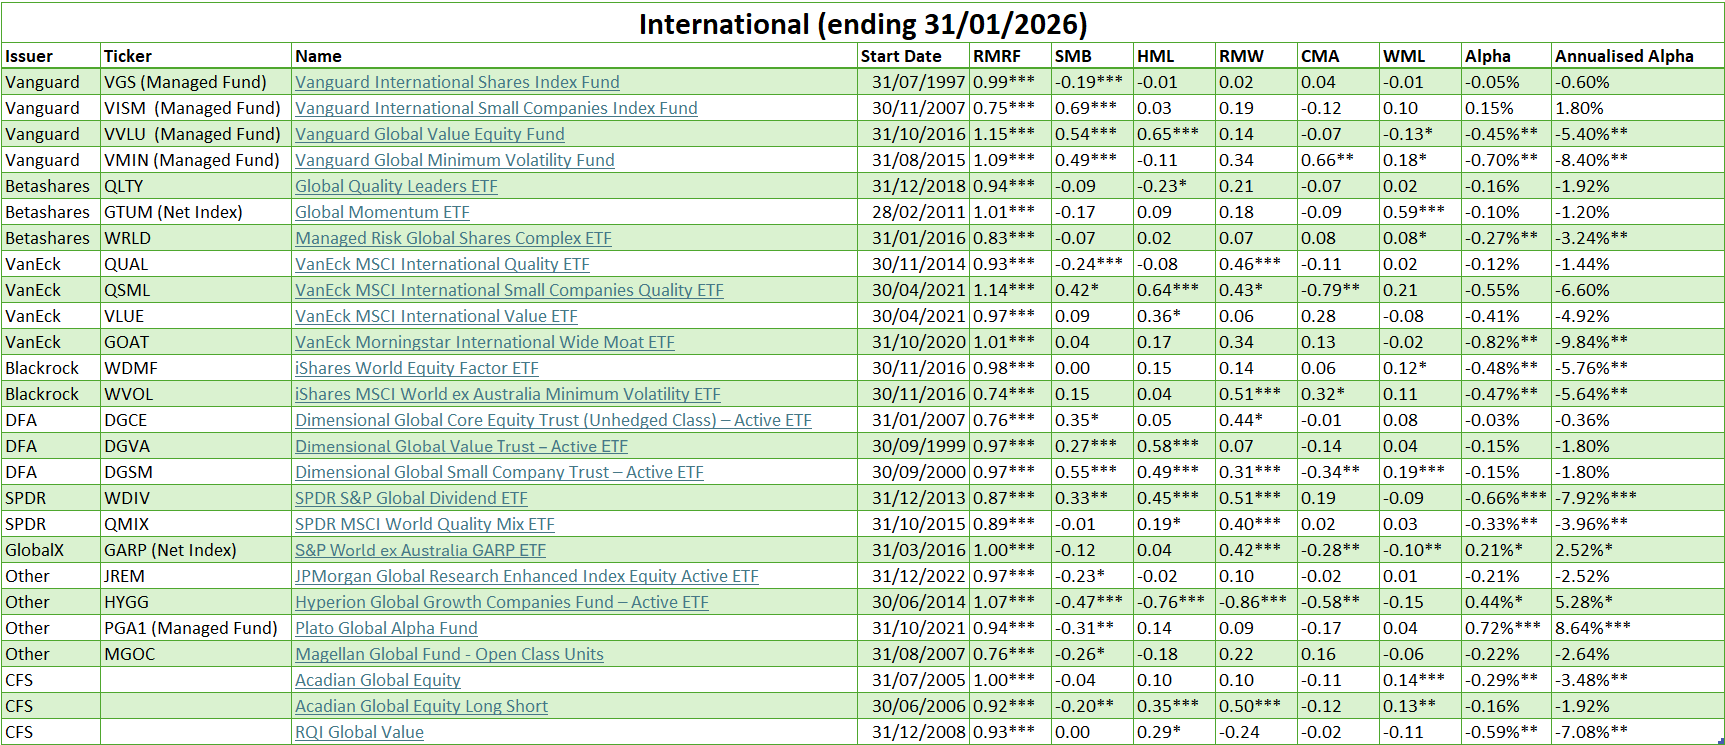
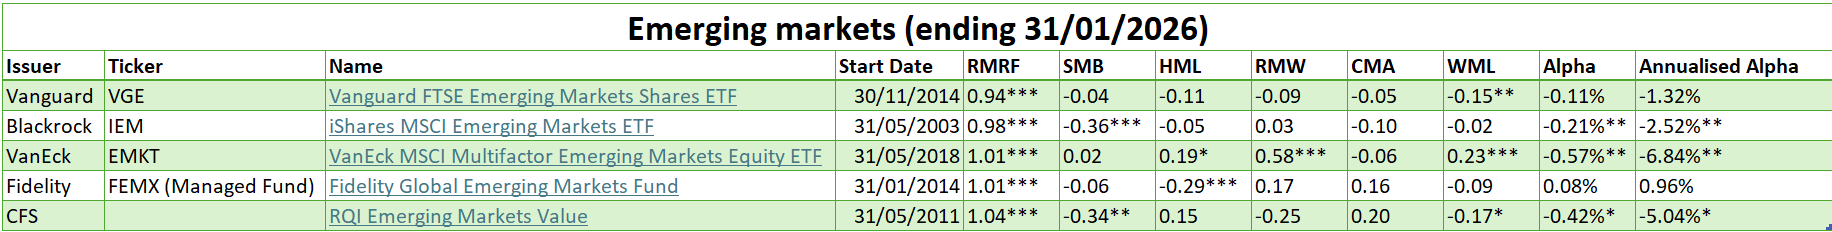
Below are the factor regression results using the Fama-French 6 Factor model, which includes Market risk (RMRF), Size (SMB), Value (HML), Profitability (RMW), Investment (CMA), and Momentum (WML):
Although the Avantis ETFs are too new to perform any regressions on, ChengSkwatalot from the Rational Reminder forums calculated daily factor regressions for the UCITS ETFs using equivalent US-domiciled ETFs (so probably 4 to 5 years of data). Their results are shown below:
| Ticker | Mkt-RF | SMB | HML | RMW | WML | Alpha |
|---|---|---|---|---|---|---|
| AVTG | 1.01*** | 0.10*** | 0.16*** | 0.07*** | 0.03*** | -0.02% |
| AVTS | 1.09*** | 0.81*** | 0.51*** | 0.25*** | 0.00 | 0.01% |
| AVTE | 1.06*** | 0.00 | 0.03 | 0.25*** | -0.15*** | 0.38%*** |