
IVV and NDQ: The problem with US concentration
When you start learning about investing, it is very likely that you have heard of the S&P 500 index, an index that invests in the top 500 US companies. It is the most well-known index that gets recommended by influencers and even popular figures like Warren Buffet. In recent times, the Nasdaq 100 has also become more trendy as a way to concentrate more into US tech stocks. The most popular ETFs Australians have used to track the S&P 500 and the Nasdaq 100 are IVV and NDQ, respectively.
Although investing in ETFs that track these indexes would likely be better than investing in individual stocks over the long term, there is still room for improvement. Investors also don’t fully understand the risks that come with investing in these ETFs, especially if they are following advice to have significant exposure to one or both of these indexes.
To explain why concentrating in the top US companies may be an issue, I’ve broken down the article into three sections:
- Great past performance of the US stock market,
- The value of international diversification, and
- Growth and technological innovation are not necessarily great investments.
Great Past Performance
It has been no secret that the US market has done extremely well over the last decade. Using the Vanguard Digital Index Chart, from 2010 to the end of 2024, the US outperformed the international market by 3.9% and the Australian market by a whopping 8.8%. Even over a longer horizon, the US outperformed the international market by 1.8% and 2.5% for the Australian market from 1970 to 2024.
It may seem foolish to NOT put all your money into the US. But it is never that simple…
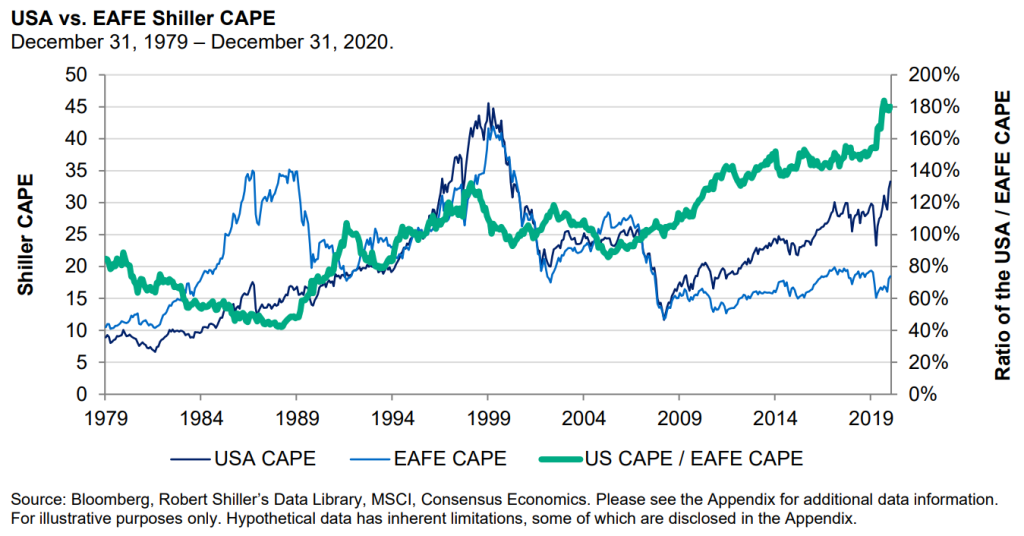
In Cliff Asness’ post, The Long Run Is Lying to You, he finds that although the US has outperformed the international market by 2.1% from 1980 to 2020, this outperformance has been largely due to valuations rising faster in the US than in the international market.
Asness shows this in the below graph, plotting the Shiller CAPE (a measure of valuations) for the US and the international market and seeing the valuation gap widening within the last decade. He then performs a regression on the difference between the US and the international market and finds that the 2.1% outperformance from before becomes a statistically insignificant 0.4% difference after taking the change in relative valuations into account.
Now, why is it such a big deal that the outperformance of the US was the result of rising valuations? Some takeaways from Coakley and Fuertes’ (2006) paper on Valuation ratios and price deviations from fundamentals:
- Valuations mean revert, so valuations can’t keep rising forever and must eventually fall to bring valuations back to their long-run equilibrium.
- High valuations tend to have lower future expected returns.
- Prices eventually reflect fundamentals in the long run.
It would not be prudent to expect the recent past performance of the US to continue in the future, as that assumes valuations must continue rising higher without mean reverting.
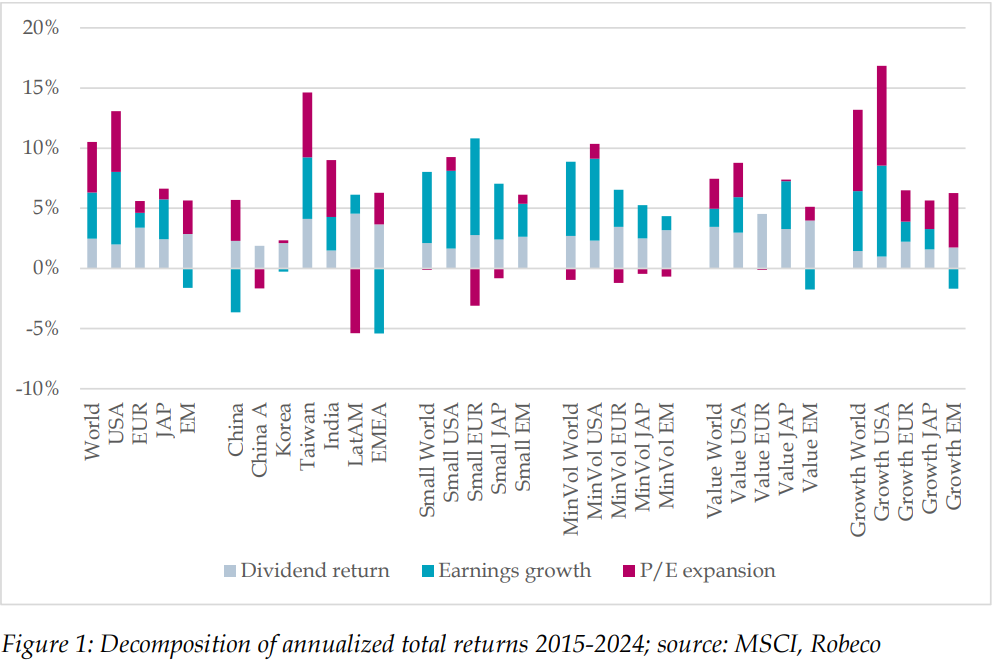
To provide further evidence to suggest that we should be sceptical of the spectacular performance of the US, Rasmussen (2025) found that companies being listed on US stock exchanges explains around 50% of the valuation gap between the US market and the international market, as opposed to better fundamentals. Blitz (2025) uses data from the start of 2015 to the end of 2024 and found that small-cap and low-volatility stocks had comparable fundamentals to US stocks but had a lower performance simply because they did not experience extreme rising valuations.
Blitz ends the article with the following remark:
Instead of simply extrapolating the recent past, investors should prepare for the possibility that the coming decade will be very different from the last. A diversified portfolio that balances exposure across regions, sectors, and asset classes, ensures resilience against potential shifts in market leadership and macroeconomic conditions. By doing so, investors can position themselves to capture opportunities regardless of how the next decade unfolds.
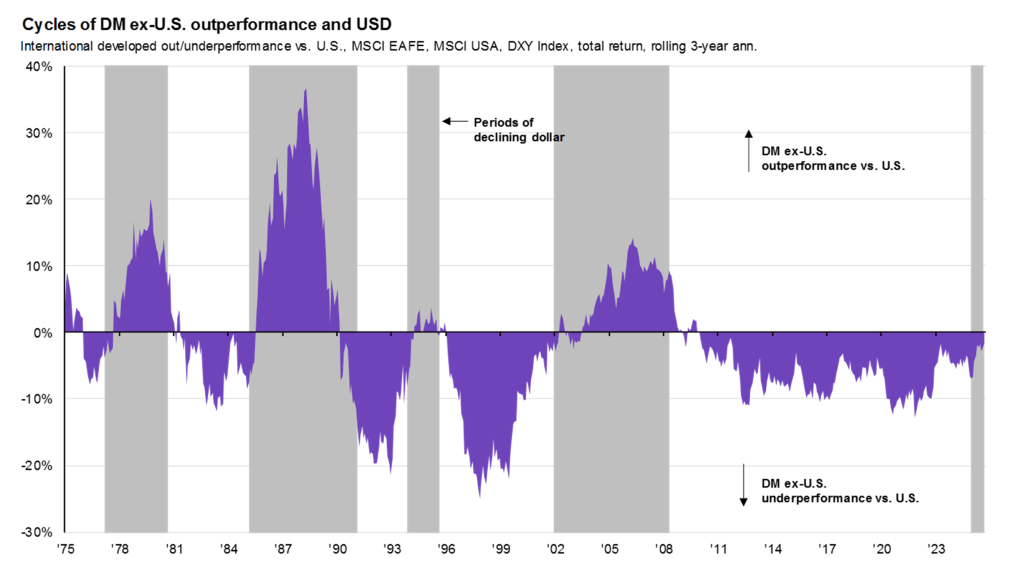
It should also be noted that there have been times before the 2010s when the international market outperformed the US. This is shown in the below chart by JP Morgan (slide 43).
For investors who want to take on more risk for higher expected returns, it is more sensible to do this by either gearing/leveraging or factor investing. With regard to factor investing, for those who hold the belief that US companies or the tech industry have better characteristics than other companies to justify the concentration, Dong, Huang, and Medhat (2023) found picking companies with desirable characteristics and diversifying across sectors and countries to be more reliable than trying to pick sectors or countries with desirable characteristics. There is also the fact that indexes like the S&P 500 or the Nasdaq 100 are predominantly large growth companies, which have lower expected returns historically according to asset pricing theory.
Yes, although the US had a great run of performance, this has been largely from rising valuations that cannot be expected to continue indefinitely. It may be hard to diversify internationally despite the evidence because of how attractive the US looks, but to quote Asness, Ilmanen, and Villalon’s (2023) article, International Diversification – Still Not Crazy after All These Years,
Unfortunately, rarely has doing the right thing been so hard (and it’s never easy).
International Diversification
To see the value of international diversification, I shall break down two arguments often used to justify not needing international exposure.
US companies get most of their revenue from foreign countries, so you are already indirectly getting international diversification.
Academic evidence suggests that the country the company is located in is what predominately affects their stock’s price (Froot and Dabora, 1998; Pirinsky and Wang, 2006; Anderson and Beracha, 2008; Crill, 2024). So yes, to get international diversification, you do need direct exposure to those international companies.
The top 500 US companies are enough to be diversified. The US and developed markets are highly correlated after all, even more so during down markets. Especially with the trend of globalisation, the benefit of international diversification would be marginal at best.
Statman and Scheid (2004, 2007) provide a nuanced discussion on the use of correlation to measure diversification. It is widely believed that a lower correlation between two assets means better diversification, but even correlations greater than 0.90 can still provide substantial diversification benefits.
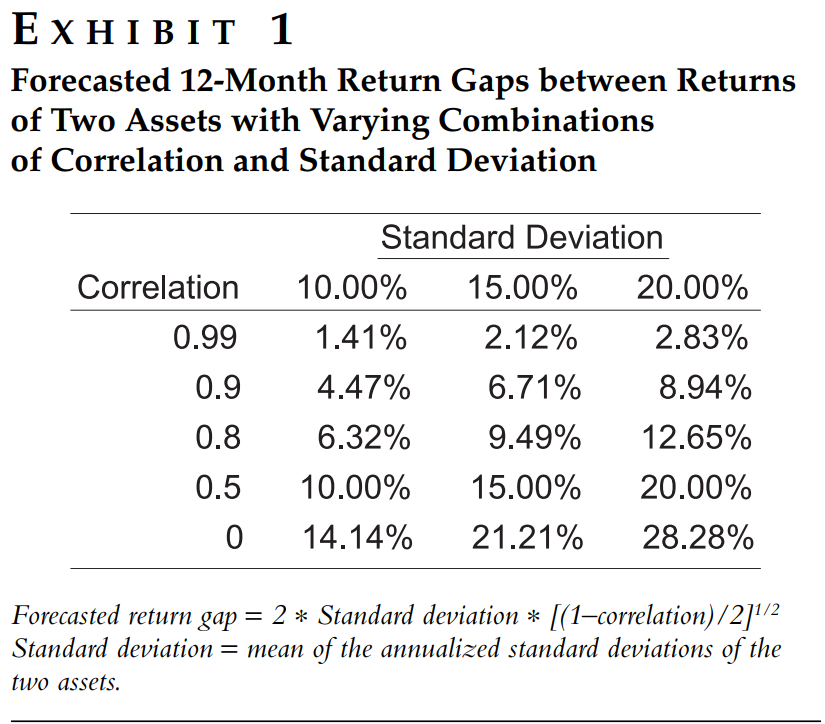
The authors theoretically show this in the below table, where they use the return gap to measure diversification, taking both correlation and standard deviation into account. The higher the return gap, the greater the diversification benefit. For example, two assets with a 20% standard deviation and a 0.8 correlation would provide better diversification than if the standard deviation was 10% with a 0.5 correlation, despite the former having a higher correlation.
Statman and Scheid provide a real-life example, where the correlation between US stocks and International stocks for the five years ending January 2007 was 0.86. This appears like International stocks didn’t provide much diversification, but over the period US stocks returned 39%, while International stocks returned 118%. That’s a 79% difference!
Correlation by itself provides an incomplete picture of diversification, because the standard deviation also plays a significant role. Lower correlations provide better diversification, but higher standard deviations also provide better diversification. Although correlations can increase during down markets, the standard deviation tends to also increase, so the benefits of diversification are not lost!
The benefit becomes greater for extended bear markets because market performance can vary greatly between countries after a market crash (Asness, Ilmanen, and Villalon, 2023). This is because despite the trend of globalisation, international diversification helps mitigate market, political, and inflation risks (Attig et al., 2023).
There’s also the fact that you are exposing yourself to more idiosyncratic risk when concentrating in the US or the tech sector, risk that is not compensated with higher returns and can be minimised by having a more balanced country and sector composition.
Thus, having direct exposure to developed markets outside the US is still worth it. That’s not even considering the diversification benefits of emerging markets (refer to Passive Emerging Market ETFs for Australians). After all, in the words of Harry Markowitz,
Diversification is the only free lunch in investing.
Growth and Technological Innovation
Novice investors often use terms like “high-growth US tech companies” or “innovation and growth in the tech/AI industry” as their justification for investing in these areas in hopes of higher returns. However, the word “growth” in finance can counterintuitively not always imply higher returns.
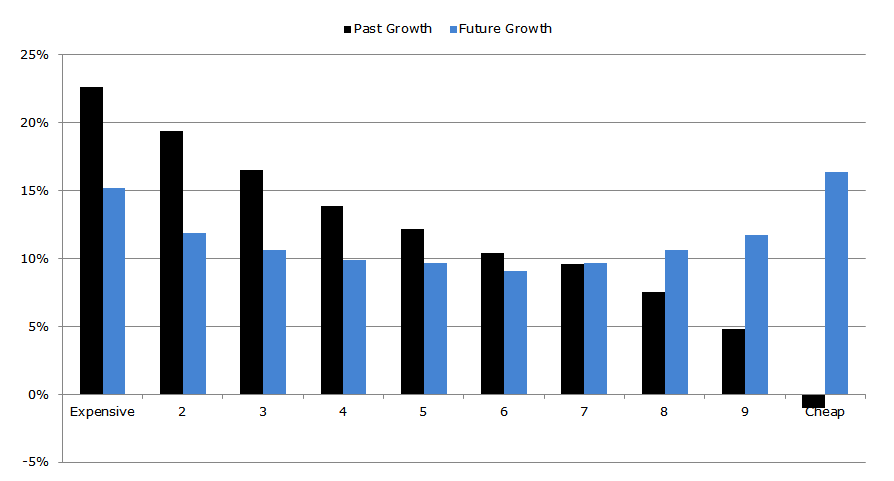
For example, as mentioned previously, growth companies historically had lower returns. One of the reasons for this is because these companies had high past earnings growth. Investors then extrapolate this past growth into the future, but these investors fail to consider mean reversion of earnings growth. This is illustrated in the below chart made by Wesley Gray, where the far left are growth/expensive companies, as evident by having the highest past growth in earnings. However, their subsequent future growth diminishes as earnings growth reverts to the mean. On the opposite side, value/cheap companies had poor past earnings growth but future growth rebounds. So growth companies and their high past earnings growth can be a trap for investors who do not realise that this generally indicates lower expected returns.
Then there is economic growth, measured by the growth of real GDP per capita. An increase in GDP growth is a result of increased capital, increased labour, and improved technology (Hsu et al., 2022). Novice investors mistakenly translate GDP growth to stock returns; however, the stock market is not the economy. Ritter (2012) finds evidence to suggest that there is no correlation between real per capita GDP growth and stock market returns (the correlation was actually negative, albeit statistically insignificant). Ritter finds similar evidence in emerging markets (Hsu et al., 2022). He states that the reason why there is no correlation is because when the economy grows, the workers and consumers are the ones that benefit, not the returns of shareholders.
Finally, if you’re still thinking about investing in the growth of the tech industry, Ben Felix has made multiple videos on the topic: Investing in Technological Revolutions, Will ARKK Recover?, and Why Betting On “Winning” Industries Almost Never Works. Below are some key takeaways:
- A bubble forms midway in the assimilation process of a technological revolution, resulting in poor returns for investors when the bubble pops (Perez, 2009).
- Prices fall when the uncertainty of growth rates decreases (Pastor and Veronesi, 2006) and the new economy integrates into the old economy (Pastor and Veronesi, 2008).
- Technology bubbles could be caused by four factors: uncertainty around the innovation, pure-play firms around the innovation (i.e., companies that specialise in the innovation), compelling narratives, and novice investors who don’t know any better (Goldfarb and Kirsch, 2019).
- “Investment returns do not come from a company’s growth. They come from the relationship between a company’s future profits and how much you, the investor, paid for those profits.” You often need to pay high prices to invest in exciting technology stocks, making it harder to get high returns.
- Industry growth in earnings is not what matters to investors. Per-share earnings growth is what matters to stock market returns. Because of “earnings dilution” (Arnott and Bernstein, 2003), per-share earnings growth can be smaller than industry growth rather than both growing at the same rate.
- There is a weak relationship between industry growth and stock market returns of the industry. Because of this, it is possible to see declining industries outperform the market rather than growing industries (Siegel and Schwartz, 2006).
- The top 10 biggest companies or the top industry at the start of a decade, on average, underperform the market the following decade.
It is very easy to fall for the hype and invest in exciting and innovative companies, but the reality is that these companies don’t necessarily make good investments. Investors fail to understand that high past earnings growth indicates lower future returns, the economy is not the stock market (the industry is also not the stock market), and there is a general lack of understanding of what actually drives stock returns.
Conclusion
That is my extensive explanation of why concentrating in the US may not be a wise decision. Those who concentrate in the top US companies do not realise that past performance can be deceiving, undervalue the importance of international diversification, or place emphasis on growth and innovation but do not fully understand what actually drives stock returns.
If you truly don’t know what will perform well in the future, you can make the neutral bet of weighting companies at their market-cap weightings and be globally diversified. ETFs like BGBL and VGS do this by giving exposure to the 22 developed countries outside Australia. This is also the bare minimum exposure super funds do for their International shares indexed option. To get full exposure to the developed markets, IVV needs to be paired with another ETF. Examples of such ETFs are VEU (noting that it is US-domiciled) and EXUS. You could similarly apply this to NDQ, but note that its sector allocations are less diversified and its MER is currently 0.48% compared to IVV’s 0.04% or BGBL’s 0.08%.
If one is uncomfortable with the concentration of US large-cap growth in their portfolio, it can make sense to increase their ex-US international exposure or allocate more towards value, as Larry Swedroe suggests.